Chongfan Technology
News
24
2026
-
04
Zhejiang University, Microvortex–Polycarbonate, Thermoplastic Polymer–Miniaturized Spectrometer
Author:
Miniaturized spectrometers hold significant application value in fields such as optical analysis, spectral imaging, and optical sensing. However, at the microscale, designing dispersive elements that offer a broad range of spectral responses without requiring external stimuli remains a formidable challenge. Conventional dispersive structures, such as diffraction gratings, encounter size-dependent performance trade-offs when scaled down to extreme dimensions and typically have large footprints, making them difficult to integrate into portable devices.
Recently, Professor Qiu Jianrong, Dr. Wang Zhuo, Assistant Researcher Zhang Bo, and other researchers from Zhejiang University published a paper in Nature Electronics, proposing a novel method for generating complex dispersion signals in thermoplastic polymer substrates such as polycarbonate by leveraging ultrafast laser–induced micro-vortices.
This scheme leverages the photoelastic effect to deliver a rich and diverse spectral response within a compact footprint of 10 × 10 μm². These dispersive structures exhibit a broad operating bandwidth (400–1,550 nm) and feature angle-independence in observation as well as strong environmental robustness. By integrating microvortex structures with image sensors, they can be employed for on-chip spectral analysis and high-resolution microscopic hyperspectral imaging.

Optical dispersion using micro-vortices in thermoplastic polymers for integrated microspectrometers. Optical dispersion of micro-vortices in thermoplastic polymers for integrated microspectrometers.
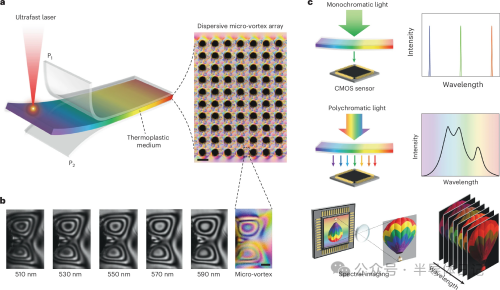
Figure 1 | Ultrafast laser–induced dispersive microvortices in thermoplastic polymers and their spectroscopic applications. a, Schematic illustration and experimental results of the generation of dispersive microvortices in a polycarbonate-based array using an ultrafast laser, with P⁺ and P⁻ denoting polarizers. b, Spectral responses of the dispersive microvortices at different wavelengths (scale bar: 20 μm). c, Schematic representations of typical spectroscopic applications based on dispersive microvortices: distinguishing the peak wavelength of monochromatic light (top), analyzing the broadband spectrum of an unknown polychromatic light (middle), and performing spectral imaging to simultaneously acquire both geometric and spectral information about an object (bottom).
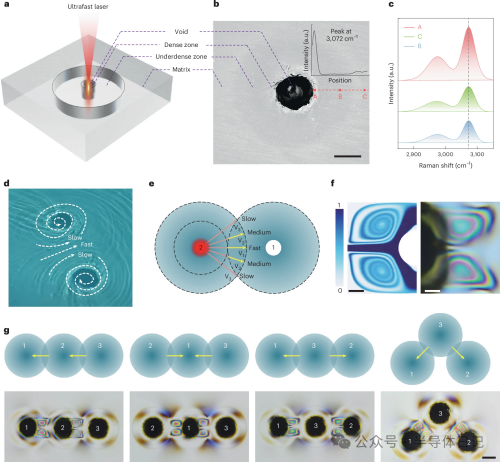
Figure 2 | Mechanism of ultrafast laser–induced dispersive microvortices in thermoplastic media. a, Schematic illustration of ultrafast laser–induced microexplosions in a thermoplastic matrix. b, Backscattered electron (BSE) image of the region irradiated by the ultrashort laser; the inset shows a Raman spectral map along the red dashed line (scale bar: 20 μm). c, Raman spectra recorded at different locations within the microexplosion zone. d, Vortices in nature arising from differential flow velocities. e, Schematic diagram of a vortex formation model based on gradient flow velocity control within the thermoplastic matrix. f, Theoretical simulation (left) and experimental results (right) of microvortex structures generated in the matrix by two successive laser pulses. g, Sequence dependence and direction dependence of vortex perception.
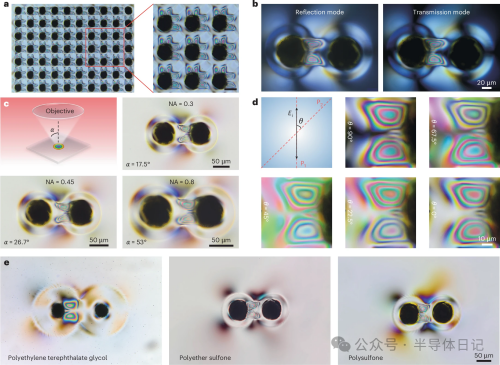
Figure 3 | Superior performance of dispersive microvortices. a, Reproducibility of vortex generation induced by ultrashort laser irradiation (scale bar: 50 μm). b, Spectral dispersion signals acquired in transmission and reflection modes. c, Verification of the robustness of microvortices by characterizing dispersion signals at different numerical apertures (NA). d, Manipulation of the optical response of microvortices by tuning the polarization direction of the illumination light. e, The versatility of this microvortex fabrication approach across multiple materials (PETG, PES, PSU).
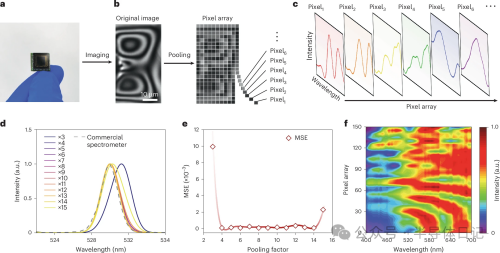
Figure 4 | Spectral detection using dispersive microvortices. a, Experimentally fabricated dispersive microvortex spectrometer. b, Pooling operation in which raw image pixels are combined according to a specified pooling factor. c, Spectral response curves of individual pixels in the pixel array. d, Reconstruction results for monochromatic light (center wavelength 530 nm) under different pooling factors. e, Mean squared error (MSE) between the reconstruction results and the reference spectrum for various pooling factors. f, Pixel-array spectral response matrix calibrated at 1 nm intervals with a pooling factor of 8.
Source: Today's New Materials
Thank you for visiting the official website of Chongfan Technology. If you have cooperation intentions or suggestions, please contact us through the following methods, and we will reply as soon as possible, thank you!
Address: Room 403, Building 6, Phase III of R&D, No. 36 Xiyong Avenue, High tech Zone, Chongqing, China.
Telephone: +86-13658337211
E-mail: Sales@cfkeji.net
Website: www.cfkeji.net
Mobile Version